
11min read
This month, I am pleased to feature Jessica Moon on she will viz. Jessica is a newly minted Tableau Public Ambassador, three times Tableau Public Viz of the Day recipient, regular contributor to your favourite Tableau Community projects and co-author of the epic #datafam project viz on Tableau Public.
I am always in awe of Jessica’s technical masterpieces in Tableau and I’m always scratching my head wondering how her vizzes are built. I ask Jessica about map layers, her involvement in community projects, reliving experiences through personal vizzing and hip hop.
Kimly: Thanks so much for agreeing to be interviewed on she will viz, Jessica. I am excited to have you on the blog! You really do perform magic with Tableau and I’d love to learn more about it.
What was your path into data viz? I’ve yet to meet someone with a conventional path and I love that!
Jessica: I have an undergrad in Nutrition and Food Science. I realized late in the program I didn’t want to work in that field. After working for a couple years in a really broad position (inventory management, facility tours, front office reports, etc), I went back to school to get something more relevant to where I saw myself headed – Contracts and Acquisition Management. The night before graduating from my MBA program, I found out I was pregnant! Fast forward about a year, I was on the hunt for a contracts position when a former colleague suggested I take up a testing role on a data viz team. I clicked with the folks on the team and said yes to the job…
After 5 years (and 2 more kids) of discovering most everything that could go wrong with Tableau dashboards utilizing data shaped and integrated with SQL or Alteryx, I decided that I wanted to switch over to building them myself. I buckled down with Tableau (many a Udemy course) and earned the Certified Associate credential. I learned Oracle SQL through Audible books, Udemy courses, and asking the Oracle developer I worked with questions. When the right role came open, I was able to make that transition, and I’ve been on the development side ever since.
During the pandemic, I decided to expand my Public portfolio beyond Bachelor visualizations. I started with Makeover Monday projects I saw posted in the Tableau Magic Facebook group. After catching a VizConnect session where Dzifa stressed the importance of connecting with the community on Twitter and vizzing in public, I was convinced to create a Twitter account myself. I started by posting Makeover Mondays on that platform, one thing led to another, and now I’m a Tableau Public Ambassador.
Making the move to Twitter was a big step in accelerating my design and analysis skills, so I highly recommend connecting to the community!!
2020 RN Salaries for #ProjectHealthViz on Tableau Public
Kimly: Technically you build a lot of “non-conventional” Tableau visualisations. I saw a tweet from you where you used map layers for an actual map! But I see map layers are used for a lot of your non-map based vizzes. I’m curious, where do you get your ideas from?
Jessica: I LOVE map layers because they really allow you to combine charts without tooltip loss and with the ability to be tiled, which I prefer. Most of my vizzes started as a vision I had when I examined the dataset, but sometimes they evolve as I go along. My Tableau Public is a creative outlet and not the chart types I use as part of my job. I enjoy including easter eggs like fun legends and song lyrics to see if anyone picks up on it too!
When I take on a Public viz, I make sure that there’s a challenge either from the data collection or visual side. This is the opportunity to learn and have previous work to reference. Tutorials are great, but only you know how you think—so having your own personal reference can often help you quickly re-create a chart or feature. I can’t tell you the amount of times I’ve copied down the Nick Saban viz when I’ve wanted to do something radial!
Nick Saban’s AL Losses on Tableau Public
Making the move to Twitter was a big step in accelerating my design and analysis skills, so I highly recommend connecting to the community!!
Kimly: One other thing I’ve noticed in your vizzes is how you cleverly and strategically use images. Some of my favourites are Teacher Salaries by Subject, Star Trek The Next Generation and Setting the Bar at Par. How do you decide which viz to include images and how the images will be incorporated?
Jessica: I have a subscription to Adobe Stock (shhh don’t tell my husband), so I do feel compelled to use it regularly—especially when the dataset has a human element. If the viz is about nurses, teachers, Bachelor contestants, etc—I like to show the people represented. Often the image I use drives the whole design.
Kimly: Looking through your Tableau Public profile, I saw your Iron Viz 2021 entry ‘Ode to Nat’. I must admit, I didn’t see this during Iron Viz season last year but it’s an absolutely beautiful viz that you’ve created for your daughter. What was it like relieving those stages of you and your daughter’s life as you went through the data, and the build of the viz?
#IronViz 2021 | Ode to Nat on Tableau Public
Jessica: Natalie is such a joy, such a happy child. But not being able to bring your baby home from the hospital is one of the toughest situations a mother can face.
I was blindsided with the diagnosis, so you can see through the Facebook posts and sentiment scores how tough it was to process that on top of postpartum hormones. I wish I could have found out while pregnant, because I could have digested the new reality and started to research what our options were prior to her birth. I reconnected with the stress from her early days as I collected the data and shaped the story but was also reminded of the turning points where it felt like we were in a better place for her care. I could finally room with her instead of having to place check-in calls with the NICU nurse during the night. Then, as things seemed to finally be on the up and up, she had a rare surgical complication where the soft palate dehisced after palate repair. Through the viz you can see the ups and downs. But there’s a focus on the triumphs because Natalie has really been able to overcome a lot!!
When thinking about what brought me joy—it was definitely my children with whom I was spending a lot of time with.
Kimly: It’s so funny you mention the smartphone giving you the ability to document and share your daughter’s life more widely than your first. For me I found it was the opposite. There are so many photos of my eldest that I shared regularly with family, but not nearly as much the second time round! What was the data collection like for a project like this? How did you collate it all? Did you have the idea in mind to viz the journey, or did the idea come later?
Jessica: I do have lots of pictures of my first, my son Russell. I had a clunky digital camera at the time, so they are mostly at-home photos that were bulk uploaded into Facebook albums. With Natalie’s early days it was less “oh look at this cute moment” and more to tell family and friends about her status and the condition itself. I later got on Instagram as an outlet to inform others about Pierre Robin Sequence through Natalie’s experiences.
This Iron Viz was timed towards the beginning of the pandemic, and we became more isolated than most people I knew to stay safe. When thinking about what brought me joy—it was definitely my children with whom I was spending a lot of time with. Natalie was who I had measurable data on. I had carefully documented her weight gain, her surgeries, and her speech evaluations. And I found it interesting to analyze the sentiment of the early posts which in my mind were neutral and informative and discover they actually reflected the negative emotions I was processing.
Both Facebook and Instagram have options to download your posts, so there was a bit of cleaning handled in Python and Alteryx. I found Excel had a sentiment analysis add-on, so I used that once I had the cleaned data. I started with a vague, high-level idea of how to tackle Nat’s journey, but it was really the poem that inspired the viz’s flow.
Kimly: Did you have any reservations about sharing something so personal with the world?
Yes. I’m not a person who is comfortable being vulnerable. I think most of the emotion is buried in the tooltips and what you see and read on the viz itself is matter-of-fact information and joyful moments from her life. I debated whether it would become unhidden on my Tableau Public which I keep on the lighter side. I believe that was a question I posed in my viz review session—should I just keep this hidden?? This was the most nerve wracking publish I have ever experienced.
Kimly: In the viz, you focus on your daughter and don’t delve too deeply into cleft palate or Pierre Robin Sequence. How did you make the decision to include what you included in this viz?
Jessica: Pierre Robin Sequence, while influential in her life, even today, is only a small part of what makes Natalie, Natalie. The theme of Iron Viz was joy, so while I gave a very high-level overview of the condition for context, the intent of the viz wasn’t to inform the audience on all the ins and outs of Pierre Robin Sequence. Natalie is a vivacious middle child whose time on the family farm to this day has her set that her future career is as a cowgirl. That being said, if any of the datafam or their friends/family has a child with a PRS diagnosis, I welcome any private messages to discuss our lessons learned and point out helpful resources.
Also don’t feel guilty if you can’t do it all. Take on what you can!
Kimly: You mentioned in the viz that your daughter’s favourite colour is red, hence the red viz, what else inspired the additional design choices you made in the viz?
Jessica: I did the Iron Viz review session that Sarah Bartlett set up and met with a couple prominent community members. Before that session, there was higher contrast and more light gray elements, but they convinced me to go with a more subtle color scheme with some of the graphs.
When I thought of the theme Joy, I thought of Ode to Joy which then became Ode to Nat. And then I discovered—an ode is a poem, so I dusted off my 8th grade poet laureate hat. Each section is separated by a line from the poem and at the time I thought darker text would help the explanatory text not compete with the poem, but now I don’t think that was the most accessible decision.
When it came to the speech section, I thought it would be worthwhile to also include videos of her progression. The videos show her going from two word sentences (a huge deal at the time) to being conversational all in half a year’s time! The farm portion might be a bit random, but it was context as to why she seems set in being a cowgirl—her time on the family farm amongst the animals displayed.
Kimly: Jessica, you participate in many community projects IronQuest, B2VB, Diversity in Data, Project Health Viz – what have you learned from participating in these projects?
When participating in community projects, it really helps to be where most of the community is. I did several Makeover Mondays when I camped out in Facebook Tableau groups, but I didn’t get the exposure to seeing many submissions. It really helps to see other people’s take on analysis and design, so you can internalize the elements that seem to work.
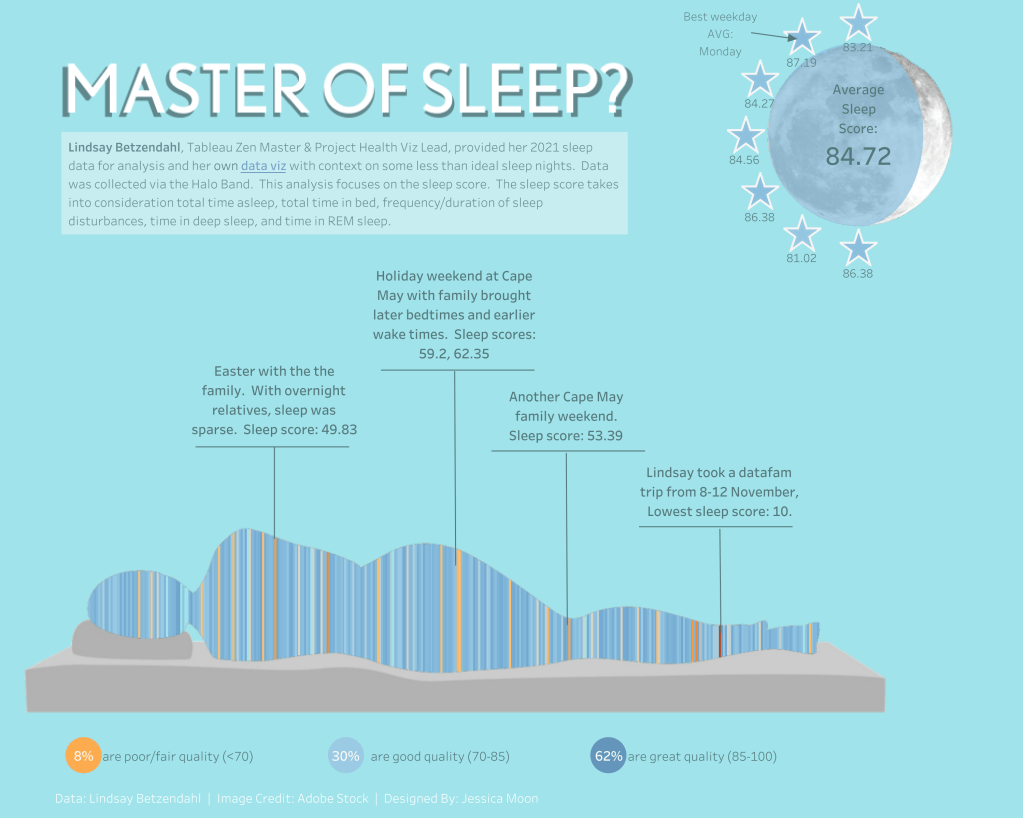
Master of Sleep: Lindsay B Sleep Data for #ProjectHealthViz on Tableau Public
Getting on Twitter helped me discover beautiful vizzes with thoughtful analysis – yours especially, Kimly! I also realized there were other community projects whose cadence worked better with my working mom schedule with very interesting topics.
Kimly: What advice would you give to people who want to make the most out of their participation in community projects? What are the benefits that you’ve seen in your growth from participating?
Jessica: I recommend participating in project challenges whose topics inspires your curiosity and interest. Those are the challenges you will put in a worthwhile effort and enjoy vizzing. Tableau Public is done on your own time, so you should make sure it doesn’t feel like work.
Also don’t feel guilty if you can’t do it all. Take on what you can! I think my vizzing skills have greatly improved from having diverse and clean datasets, continued practice, and being able to learn from others.
Kimly: And can we talk about your hip hop? I think it’s so wonderful that you do this. How did that come about?
I danced when I was younger and really enjoyed it. Earlier this year, I discovered there was an adult class at my daughter’s studio. Hip hop is the highlight of my week, and I’m not bad for a middle-aged woman. Our class even performed at recital!
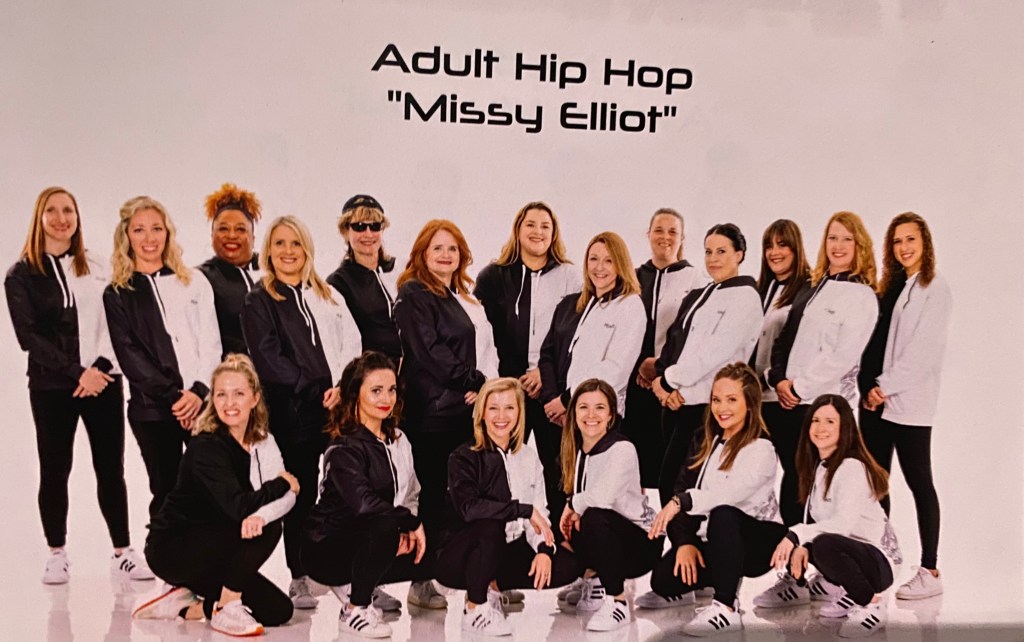
Jessica’s hip hop!
Until the class focuses on learning the showcase or recital dance, there’s ~3 classes per routine. This fall we’ve learned choreography for Ciera’s Get Up and DJ Khaled’s Bill’s Paid. There’s a Facebook thread all the attendees are on, and the instructor sends a video of the dance so we can pick up on choreography we missed and practice. My husband and kids could tell you that I do practice plenty. Then at the next class I’m like I’m pumped, I’m ready, let’s add on!! Yeah, I love my hip hop class!
Kimly: Who are some inspiring women that you follow or look up to in the data viz community?
Jessica: First and foremost, Elisa Davis is really an amazing woman I look up to. I messaged her a while back asking about her experience in Millennials And Data, and we’ve had regular back and forth ever since. She’s someone I can bounce ideas off of and get really great advice from, plus she’s doing incredible work supporting the #B2VB project which is one of my favourites!
Michelle Frayman reached out to me after seeing my Ode to Nat Iron Viz entry and got me connected with #MomsWhoViz which has been an amazing, supportive resource. I met her and her family on one of Natalie’s Boston follow-up trips and they’re really wonderful people! I get the best viz feedback when I visit Michelle and Nicole Klassen in Office Hours, and I really like Michelle’s bold design and Nicole’s thorough approach when they release new work. Both Michelle and Nicole are so involved in the Tableau community, making it a much better place!
I followed Dinushki De Livera and Jennifer Dawes early in my Twitter journey and love their herdata interviews to get to know other datafam members, and I also enjoy exploring their eye-catching designs they produce in their Public work.
Nicole Mark is someone who participates in some of the same projects I do whose work has really helped me improve my own, and she publishes awesome content on her blog!
Lindsay Betzendahl has been a great follow for incredible design and Figma tutorials, and her project #ProjectHealthViz introduced me to interesting datasets that have helped me improve my visualization skills.
Sarah Bartlett creates beautiful, clean dashboards, and her initiative #IronQuest, has helped me and others get prepared for the increasingly frequent Iron Viz qualifiers.
Finally, it really meant a lot to see you, Kimly Scott, and Lisa Trescott on the stage at these last two Iron Viz competitions displaying such incredible data storytelling skills!! I hope that another woman graces the stage at next year’s competition!!
***
Thank you so much for your time and for being so open to sharing your story with us, Jessica. I encourage everyone to check out Jessica’s work on Tableau Public for inspiration and jaw dropping vizzes. And don’t forget to follow Jessica on Twitter.
Kimly
