
A couple of weeks ago I dropped a hint on twitter that something was brewing…I was working on a new project and I was excited.
The love and excitement from the datafam was truly magnificent – even though no one knew what this new project was about!
The wait is officially over. I am ecstatic to announce the launch of she will viz – a platform dedicated to amplifying and giving rise to women voices in the data visualisation community.
The Matilda Effect in data viz
she will viz was born from many things.
Earlier this year, I published a viz to my Tableau Public profile in honour of Women’s History Month. It was called, The Matilda Effect and the Forgotten Women Scientists.
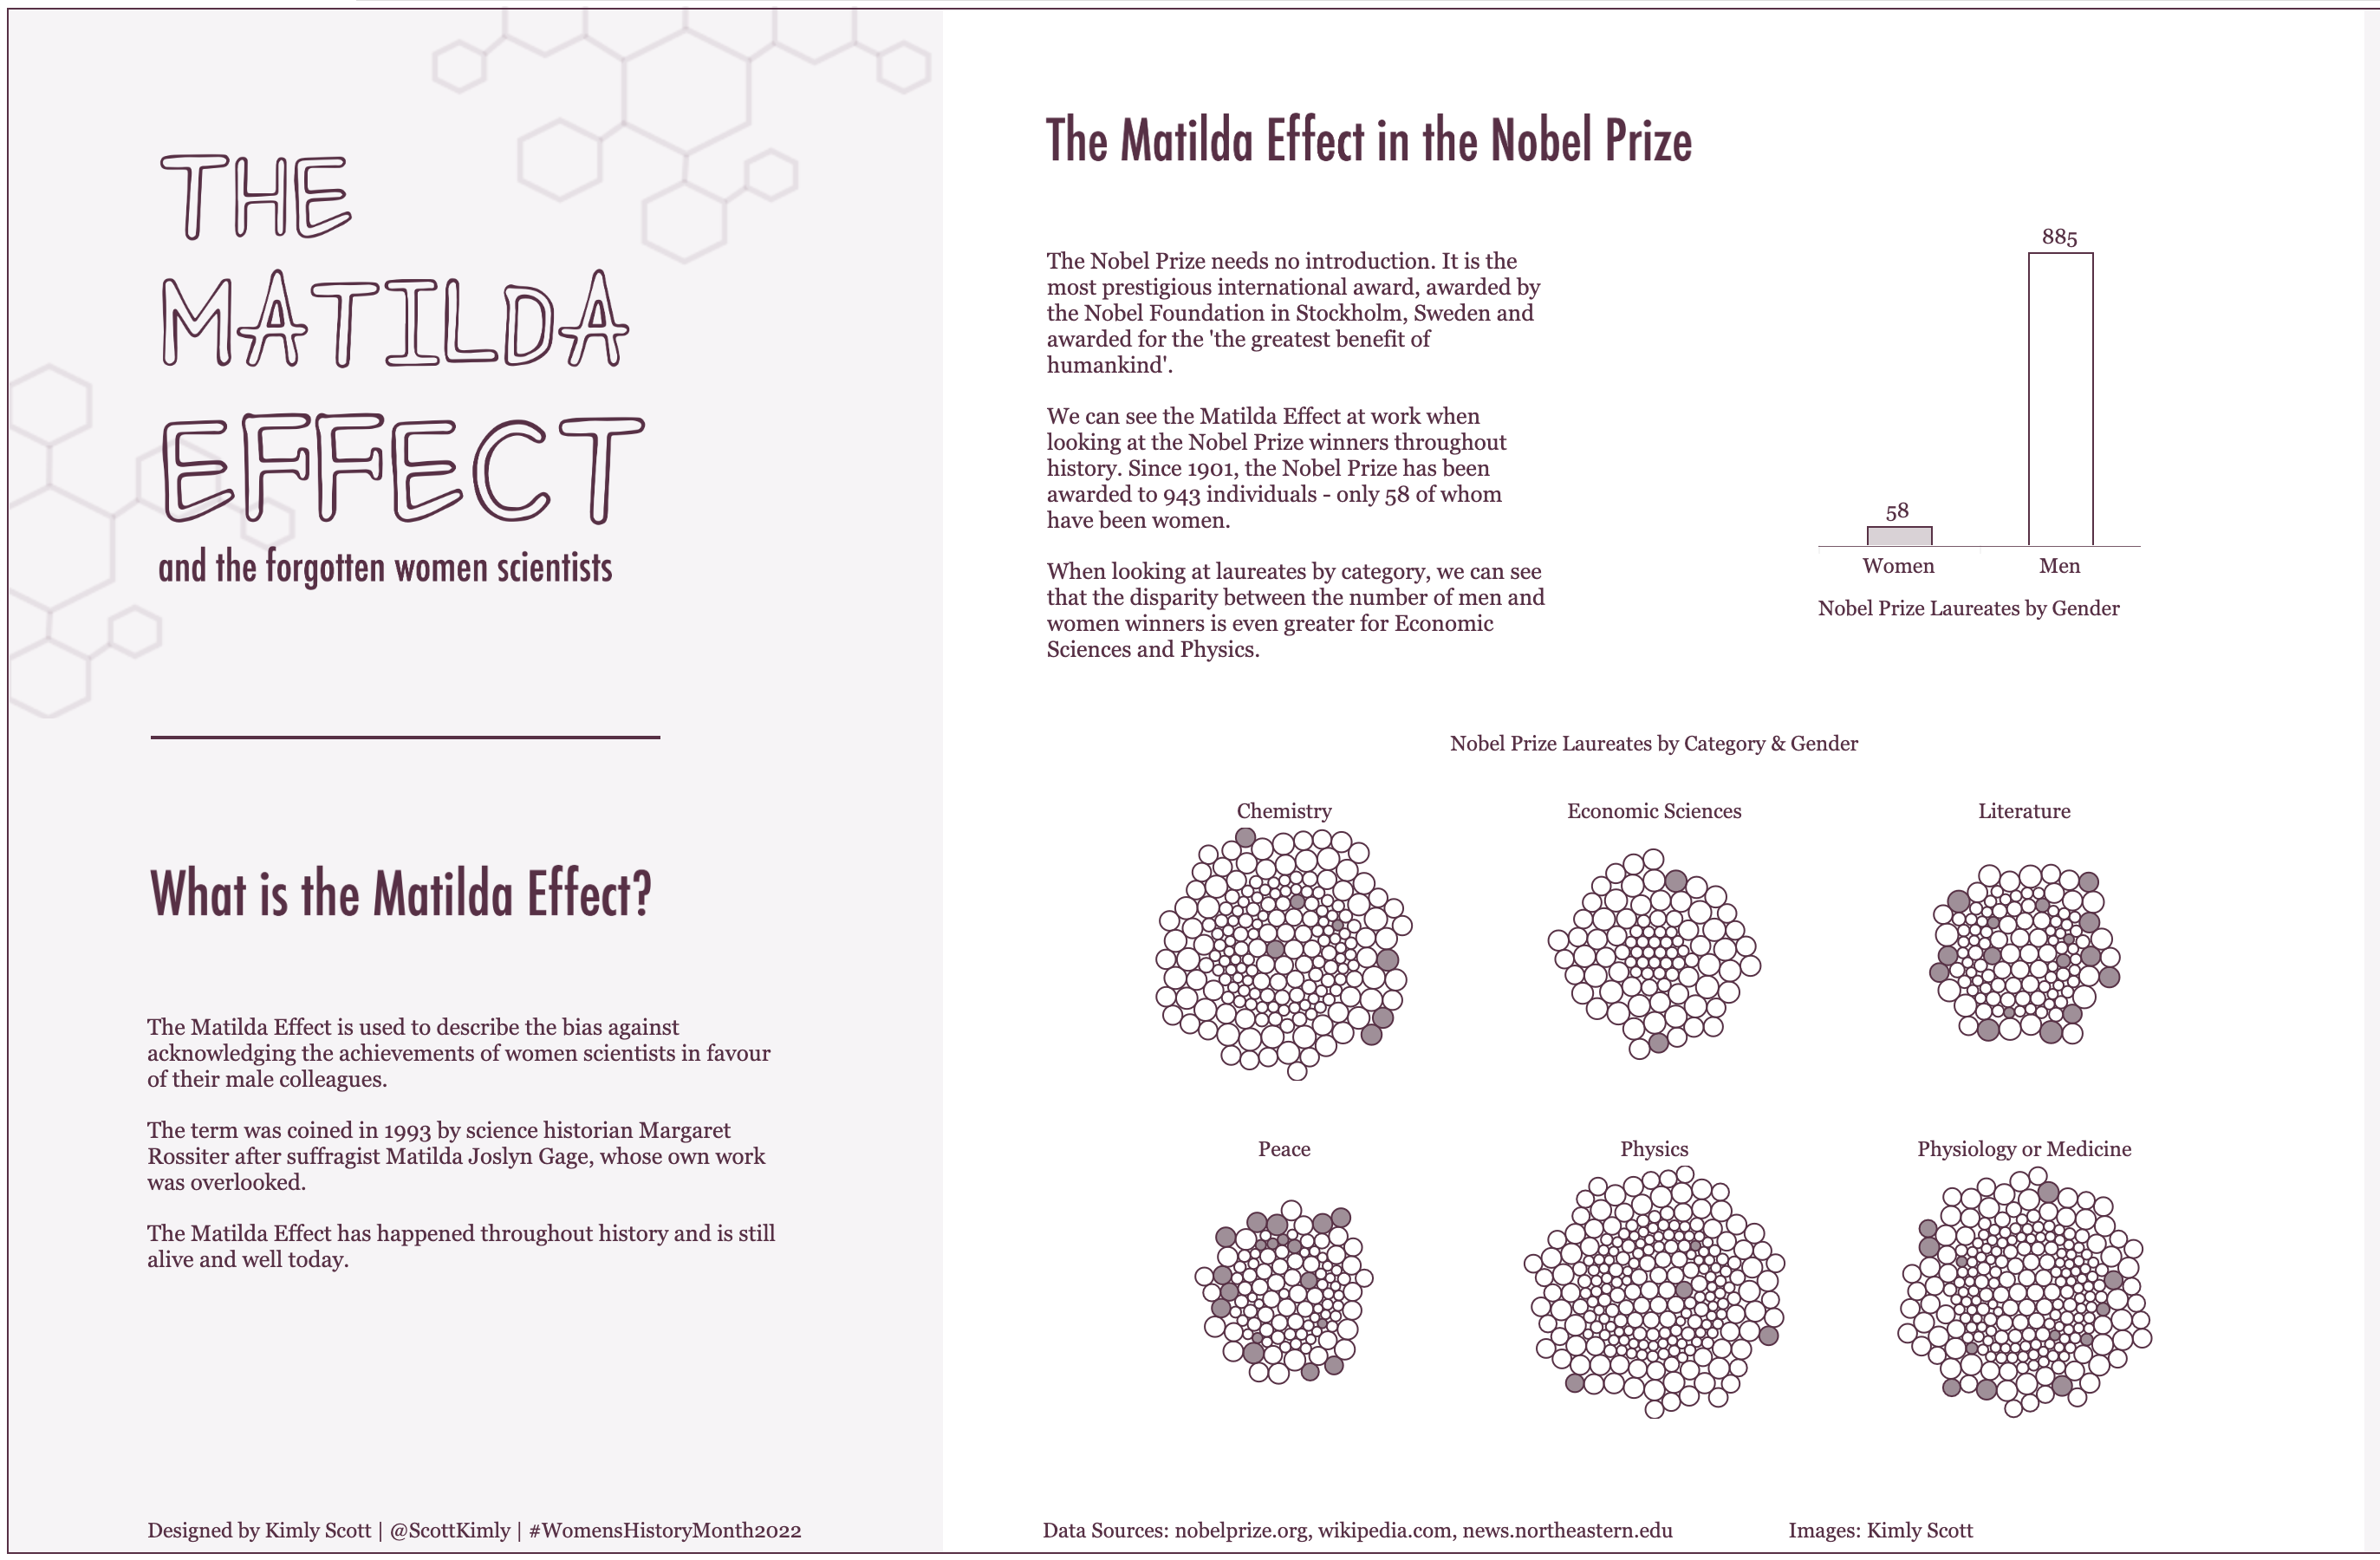
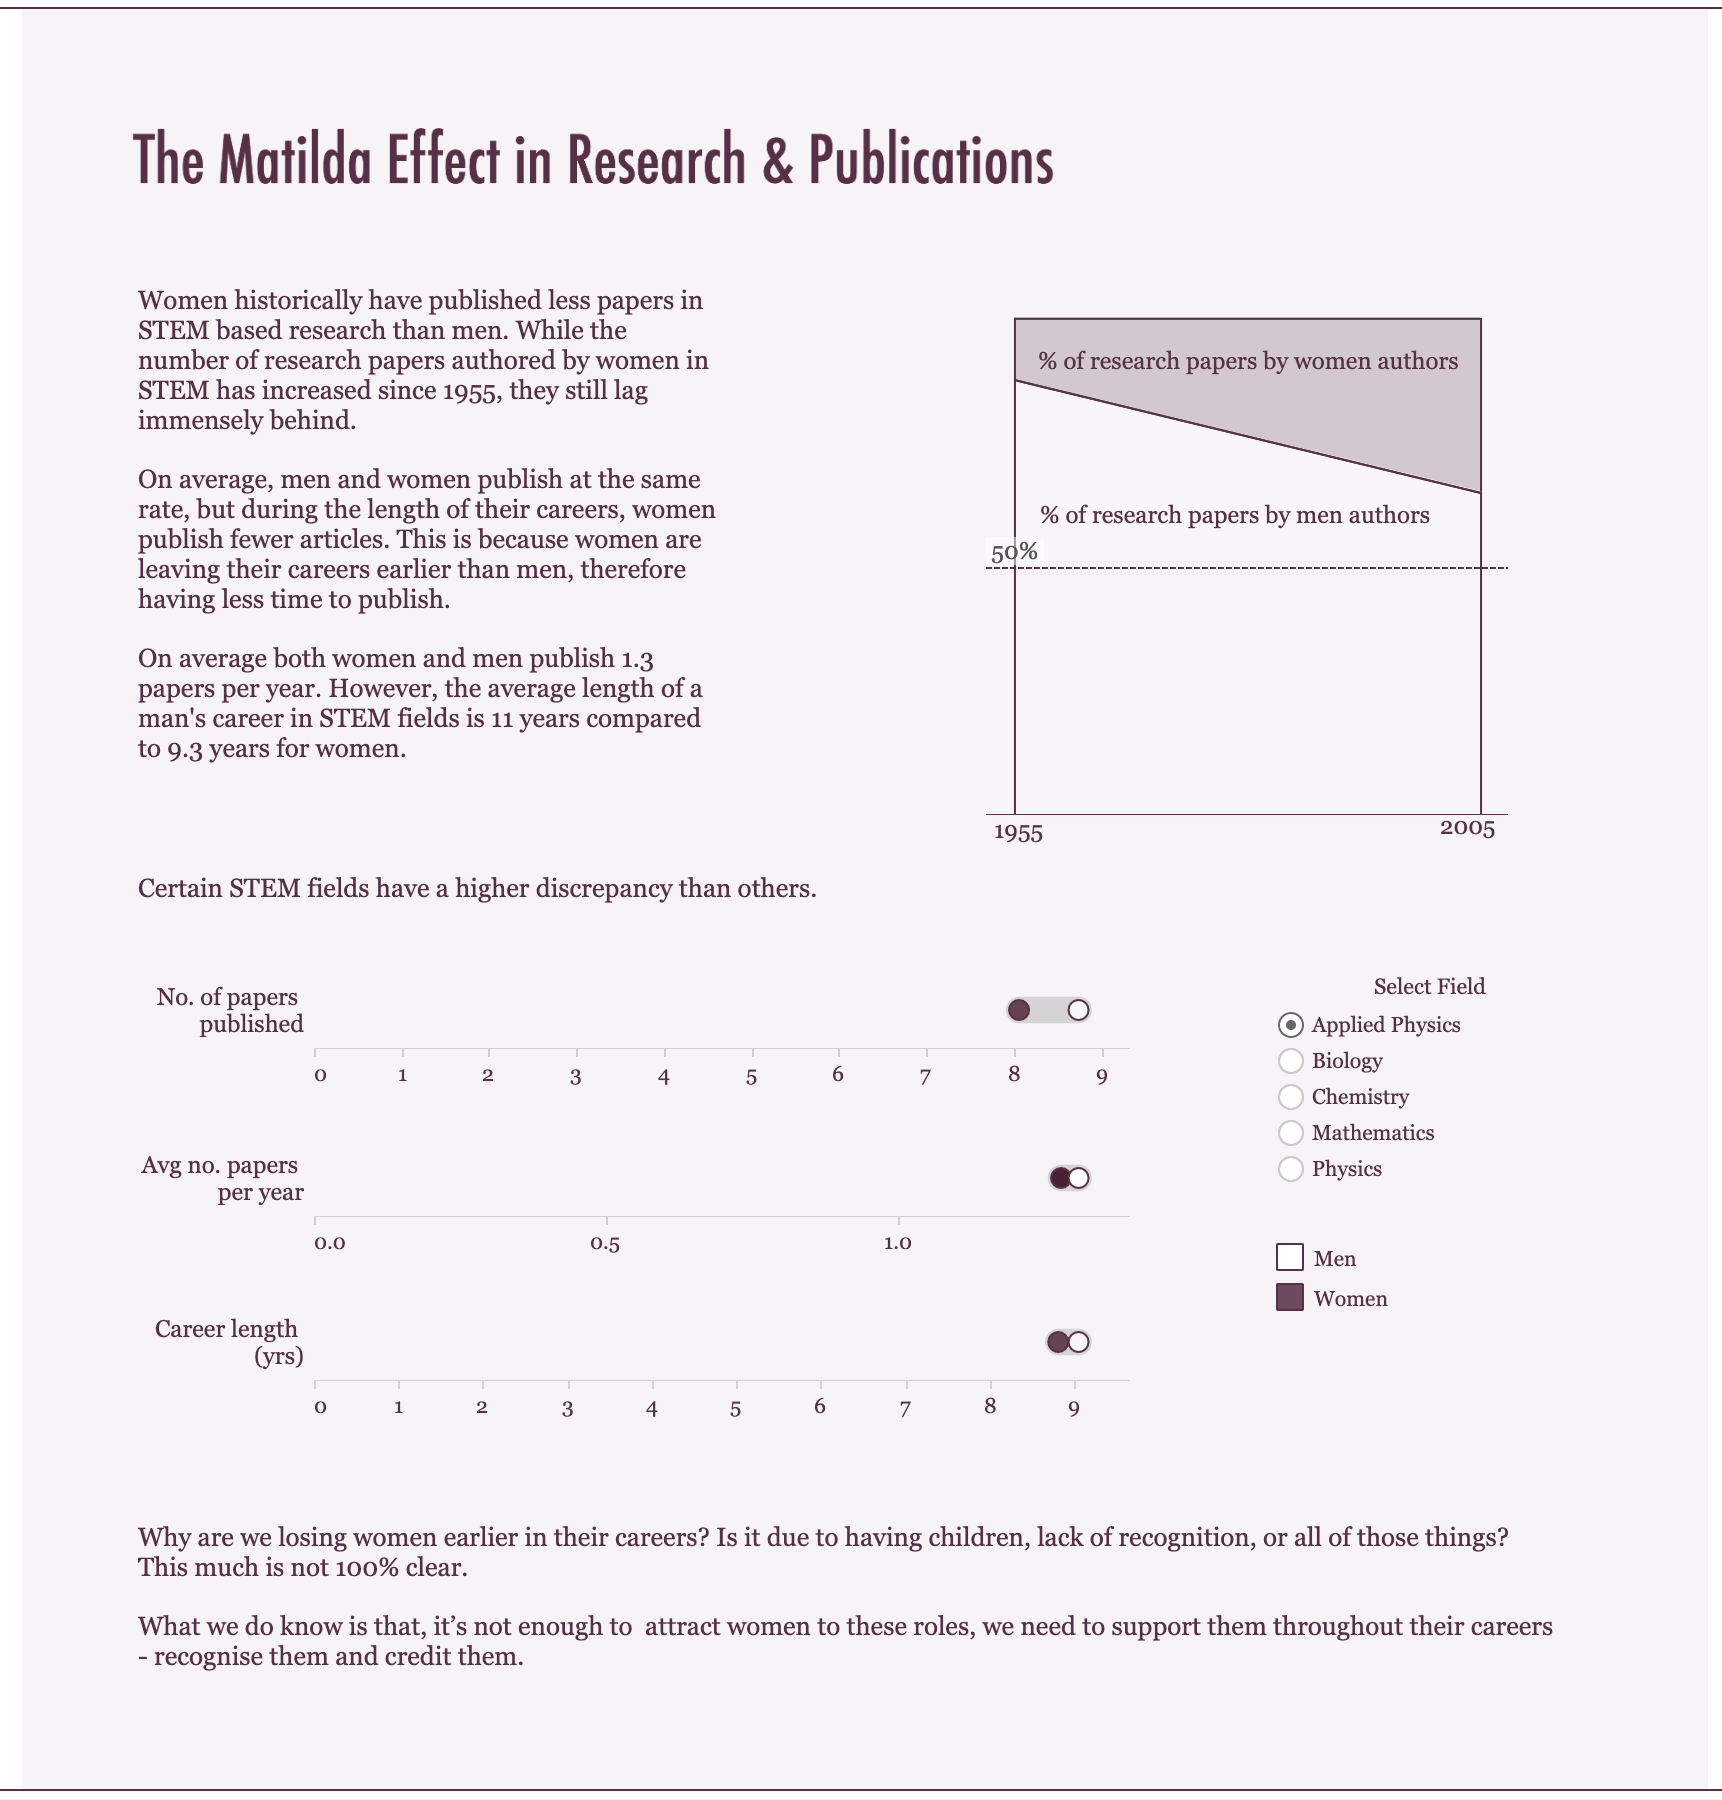
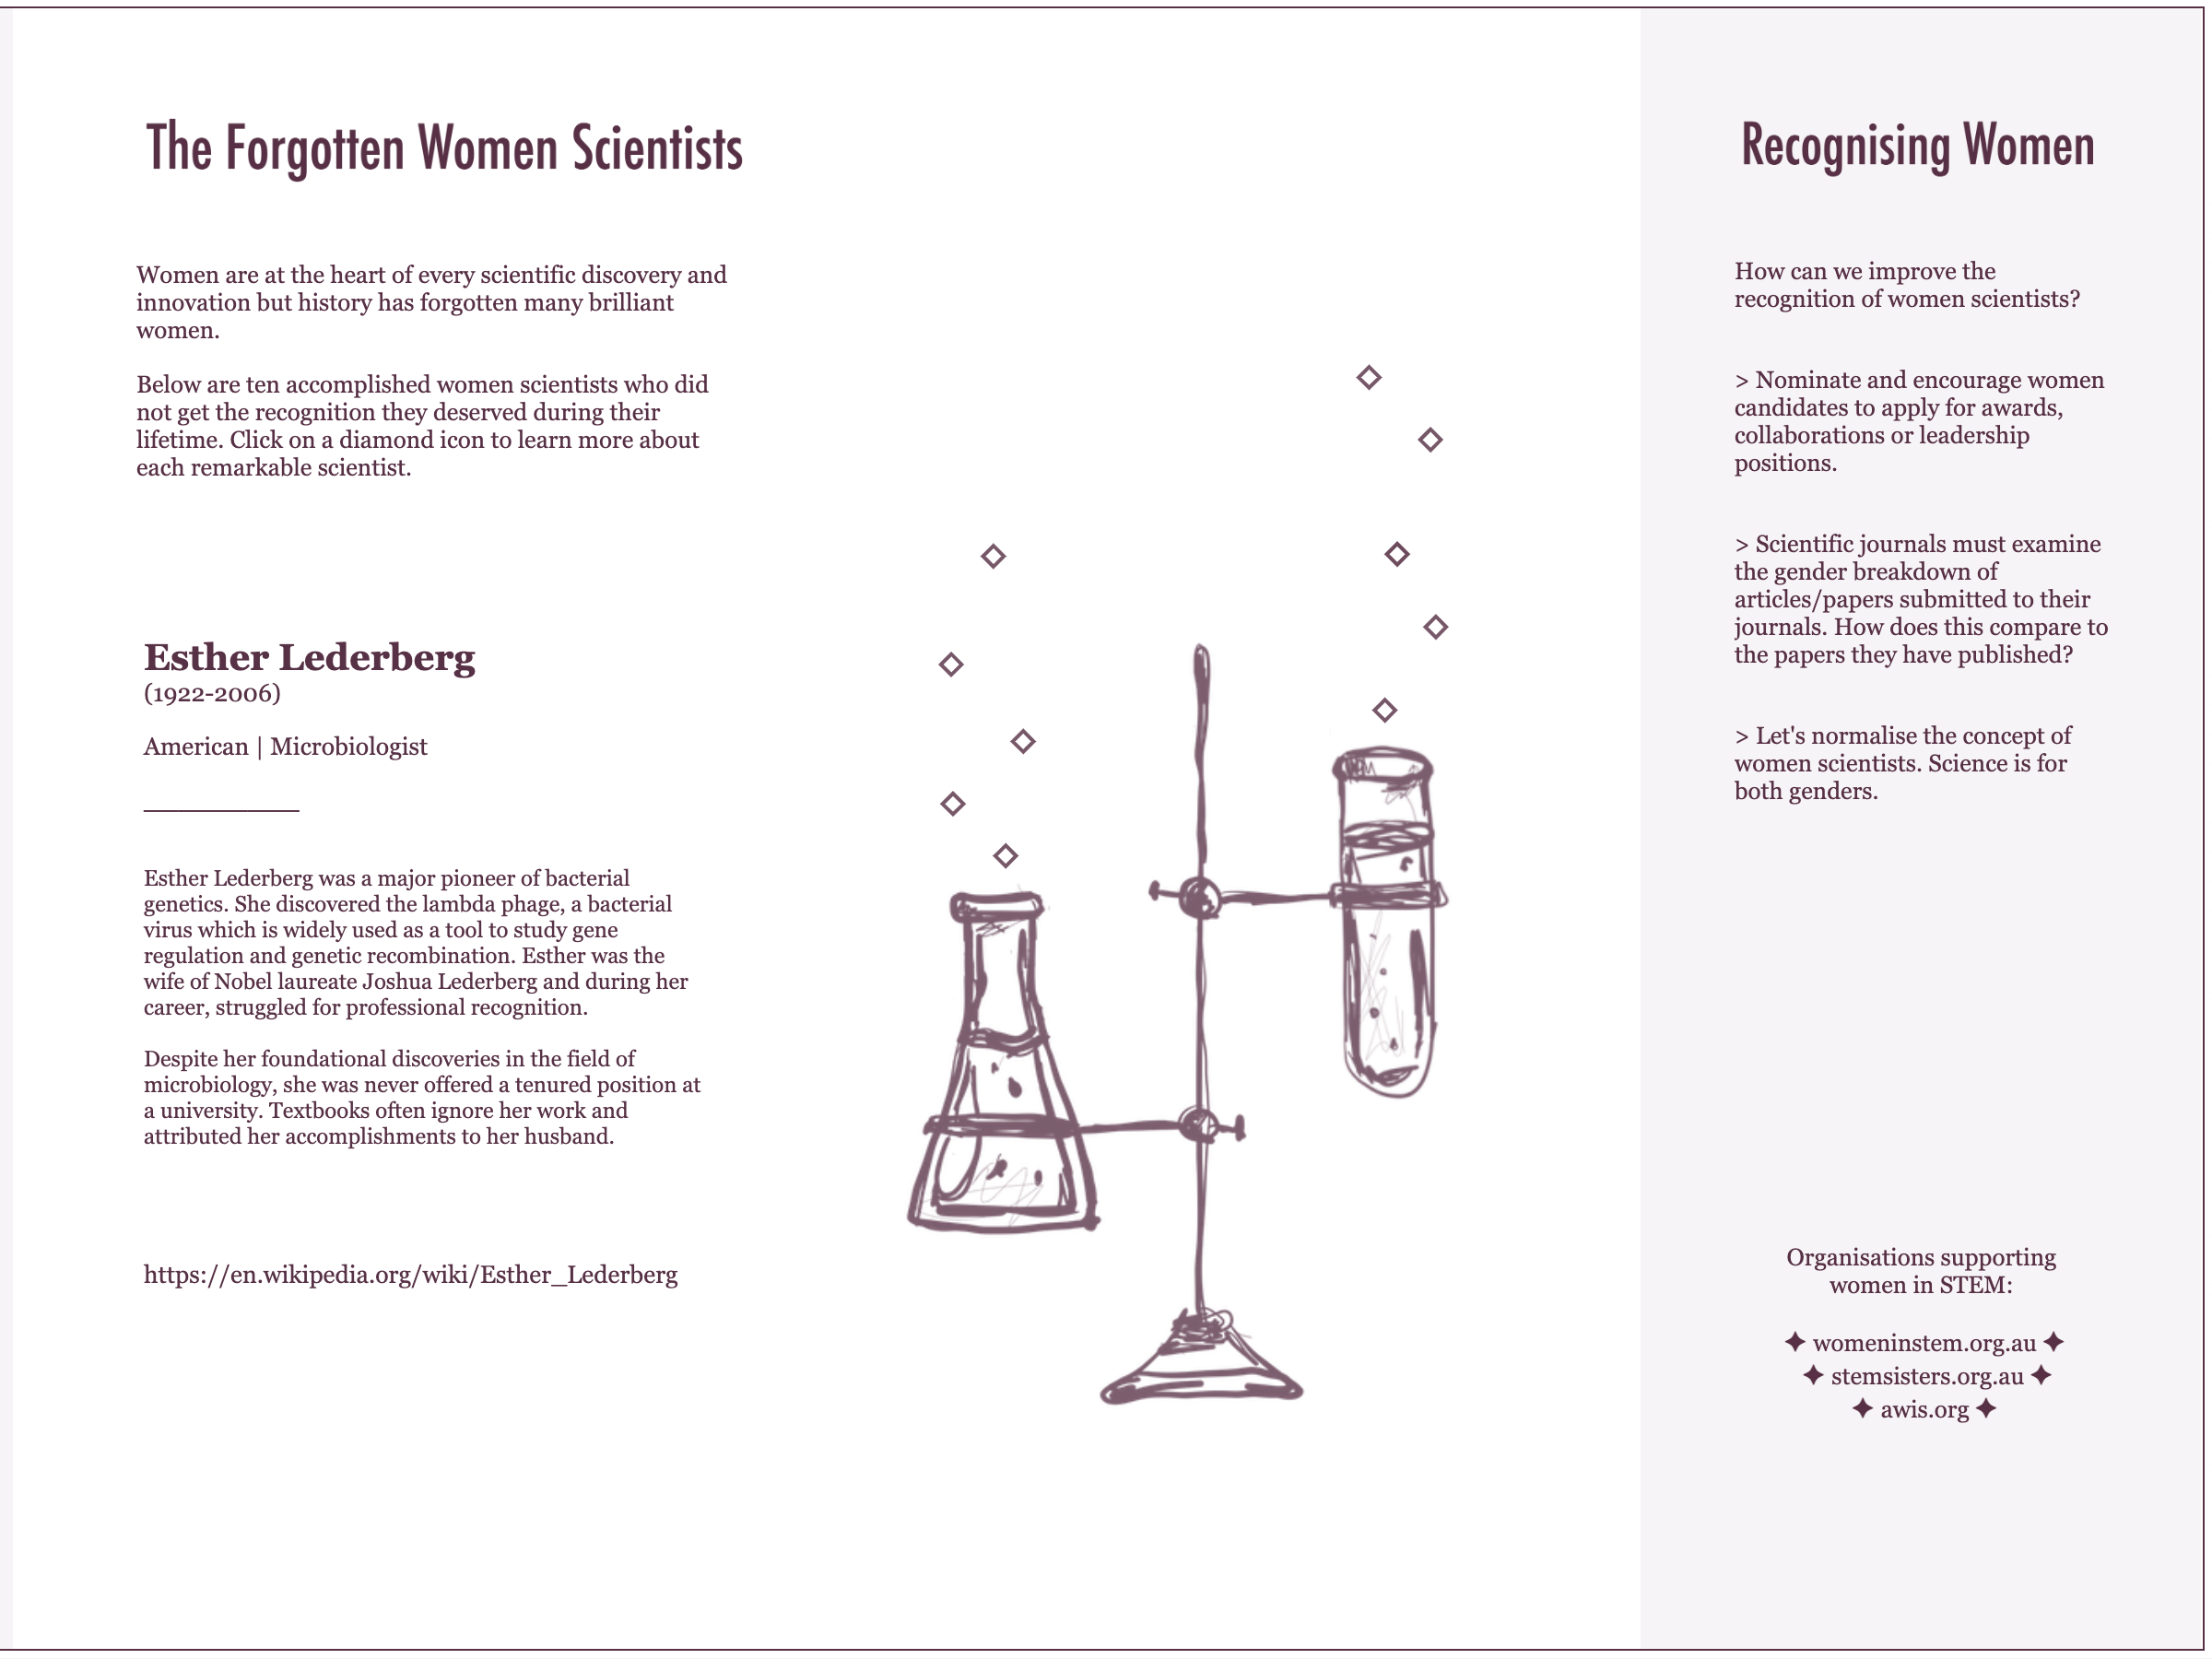
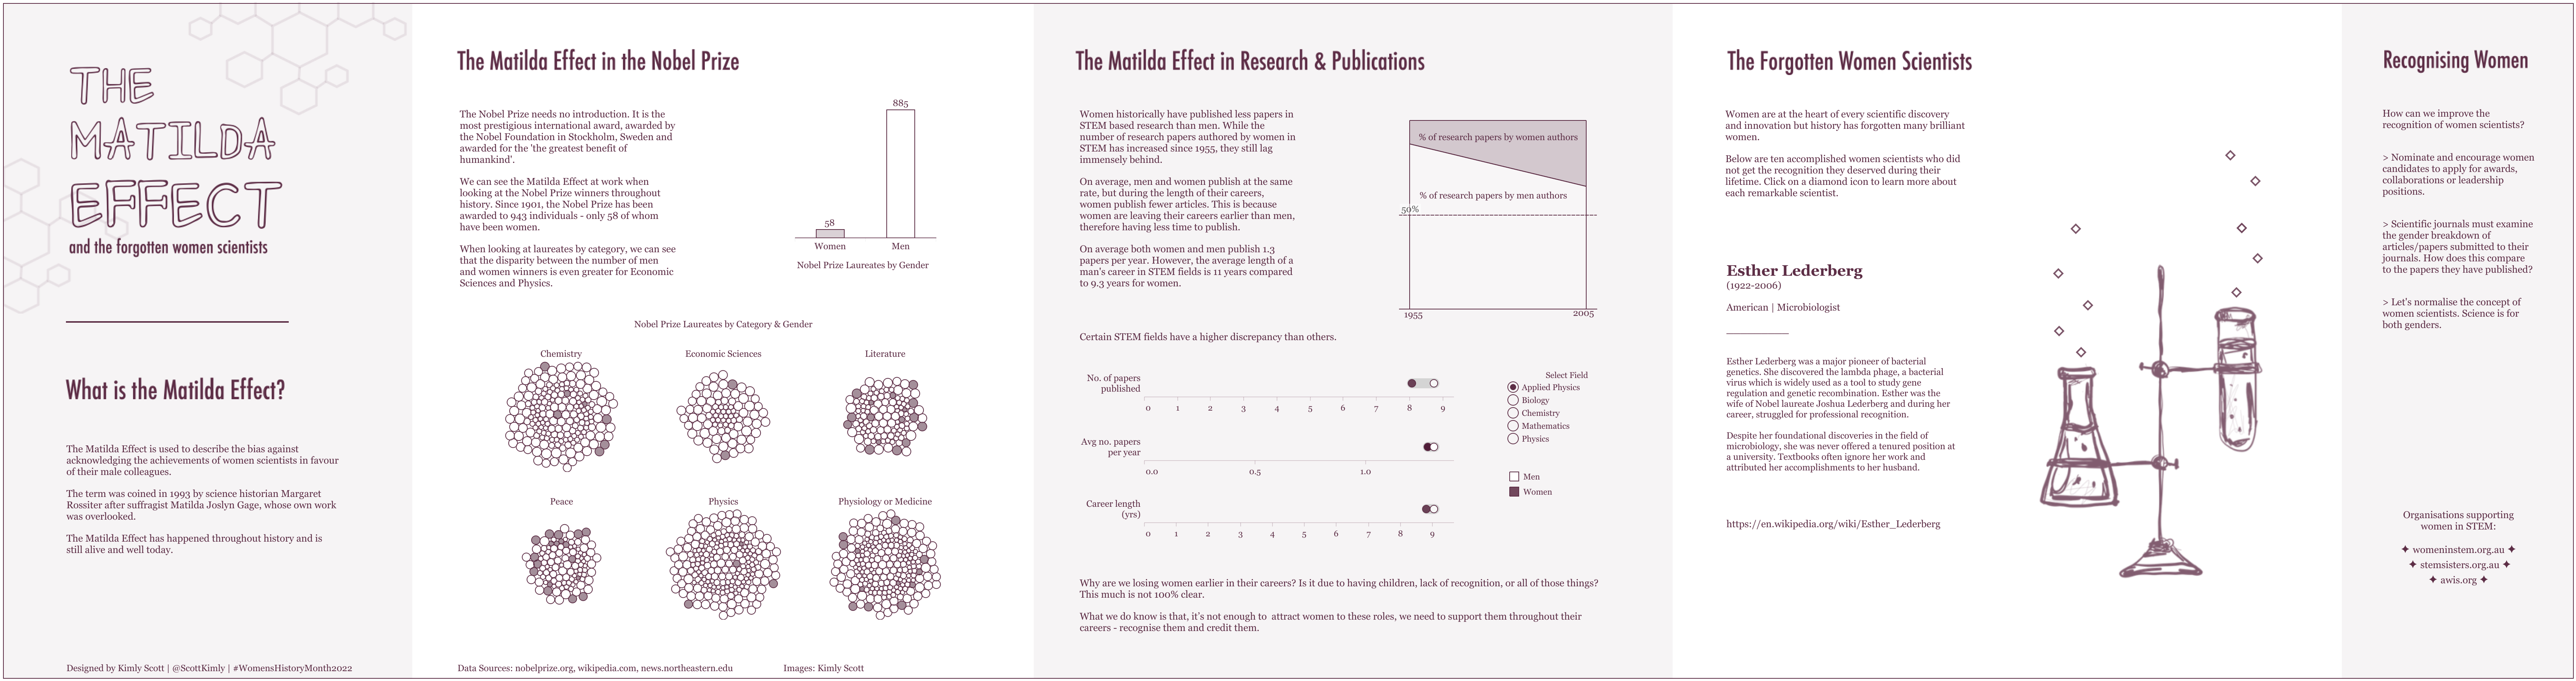
The viz talks about a bias called the Matilda Effect whereby acknowledgements of women’s achievements are overlooked in favour of their male colleagues. I was disheartened to see this happening in the Tableau Community.
The community puts out some truly amazing content ranging from tutorials to blog posts to interviews with other community members – all an effort to teach and inspire. But for a long time, I have noticed that women’s voices are few and far between. Women should be celebrated year round – not just one month out of the year.
Furthermore, after competing in this year’s Tableau Iron Viz finals, I engaged in many discussions with the data viz community about representation. Many people felt there was a lack of representation in the competition and in data viz in general – the fact that during the 11 years that Iron Viz has been running, I was the first woman of colour in the finals was very telling.
You can read about my reflections on Iron Viz here – where I talk about how much it meant to me to represent Australia, Cambodia, women and mothers on the Iron Viz stage.
I am passionate about diversity and gender equality. I viz about diversity and gender equality in an effort to highlight issues surrounding these topics. And I recently started as co-lead for Diversity in Data, but I felt like this was not enough – vizzing was not enough. I had to do more if I wanted to change the world. I kept coming back to the quote by Mahathma Gandhi,
You must be the change you wish to see in the world.
Mahathma Gandhi
So I had an idea – what if I launched my own platform that only featured women.
After chatting to the wonderful Nicole Klassen, I was more determined than ever to get this off the ground. Nicole gave me the push and encouragement I needed – the community needs something like this.
There are so many amazingly talented women in the Tableau and wider data viz community, but their voices are not being heard or they are not being invited to the table. I had to be the change I wished to see and this would be my contribution to help close the gender gap in data viz.
she will viz and butterflies
The butterfly is a symbol of metamorphosis; of change. So I thought a butterfly was a fitting representation for she will viz. My goal is to change the data viz landscape and the voices you hear from in this space. I want to showcase the women who make data viz what it is – the women who inspire me and you every single day.
Women are stronger when we support each other
Initially, she will viz will feature interviews with women – women who are new to dataviz, veterans of the industry – any woman whom you believe has a story to tell. I am only connected to a small network of women in the data viz community, so let me know if there is anyone you wish to hear from. And if you are a woman, identify as a woman or non-binary, I want to hear your story. You can contact me via the form here.
I don’t know what the future holds, but my hope is that she will viz will become a platform to support and showcase women in data viz – and maybe that means the addition of women guest bloggers, information on women-led initiatives, or perhaps a database of women speakers. What I do know, is that I am extremely excited to share she will viz with you all.
Stay tuned for the release of my first interview with a friend and community member who has made such an incredible contribution within her first year of joining the datafam.
When women support women, amazing things can happen.
Viola Davis
– Kimly
P.S. Many many thanks to Nicole Klassen for being an early sounding board on this project and for reviewing this blog post.
Image credits: Logo designed by Kimly Scott, feature image by Kimly Scott with inspiration from pikisuperstar – http://www.freepik.com

You really are an inspiration Kimly. I’m proud to know you.
LikeLike
Thank you Nina! Proud to know you too.
LikeLike
[…] แต่ เพิ่ง เริ่มต้นบล็อก She Will Viz […]
LikeLike
[…] fellow Aussie has been in the Tableau Community for a few years, yet only just recently started the She Will Viz blog focused on raising women’s voices in data […]
LikeLike
[…] fellow Aussie has been in the Tableau Community for a few years, yet only just recently started the She Will Viz blog focused on raising women’s voices in data […]
LikeLike
I love this! I’ve also been thinking a lot about the lack of representation of women in data viz. Thanks for putting this project together!!
LikeLike
Thank you Jenn!
LikeLike