
6min read
Hello everyone! I know it’s been some time since my last interview, but you know: life. However, believe me, the wait is worth it.
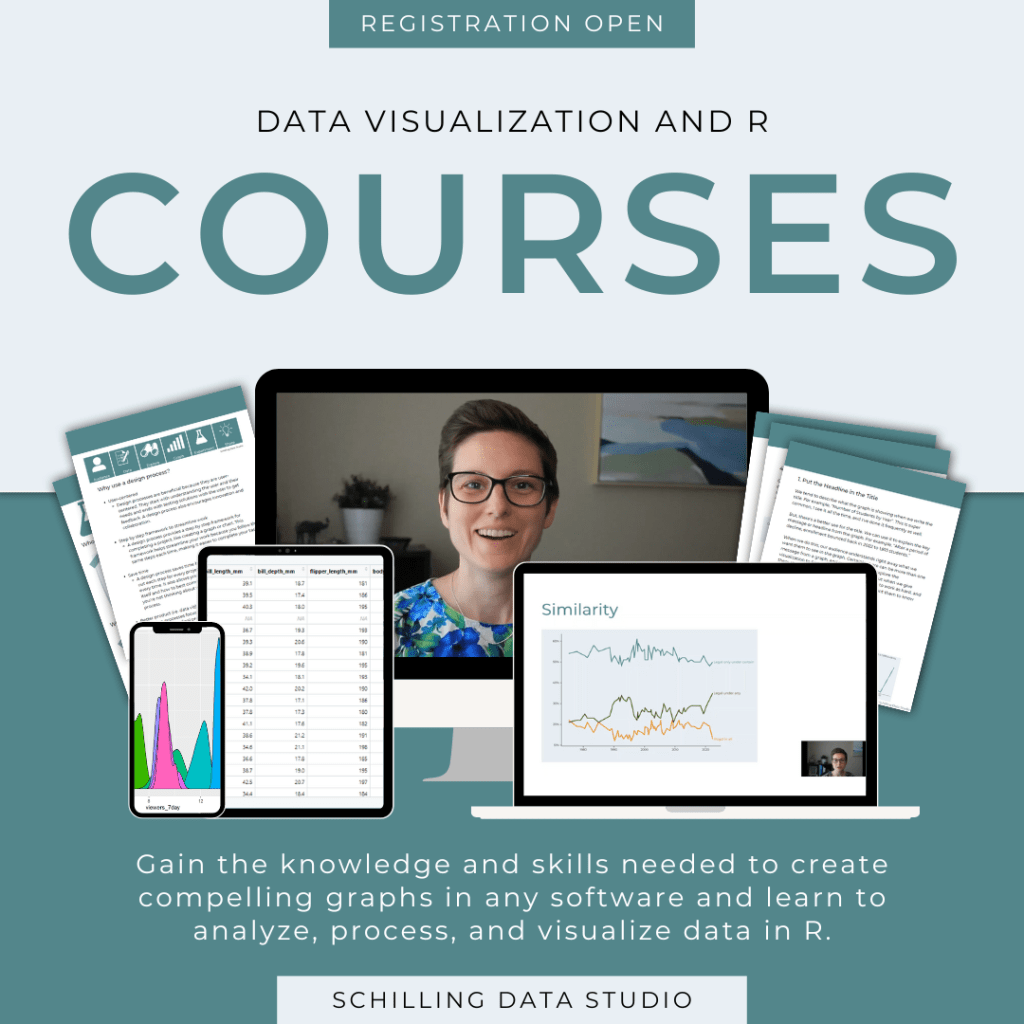
In this edition of she will viz, I have R Studio extraordinaire and all ’round data viz legend, Jenn Schilling. Jenn is the owner of Schilling Data Studio, and has helped countless people to up their data viz game. We chat about the benefits of teaching others and why Jenn loves R Studio so much.
Kimly: Thank you so much Jenn, for taking the time to share your story with me for she will viz. Firstly, how did you get into data visualisation? What did your journey look like?
Jenn: I got into data visualisation during my first full-time job when I learned Tableau and was sent to a one-day training. I just found the principles of data visualisation so fascinating, and I really enjoyed making data more accessible and engaging to people through visualisation. My journey has involved a lot of self-study through reading books about data visualisation and practicing with different datasets. I’ve also gained a lot of practice through work projects and learned a lot from colleagues and mentors. Collaboration with others has also been a great way for me to learn more about data visualisation and develop my skills.
Kimly: In addition to your blog and the pearls of wisdom you share on Twitter and via the Data Visualisation Society (DVS), you also teach and coach others as part of Schilling Data Studio. You even have your own courses where you teach about R and the basics of data viz. What drew you to teaching? How did you first get involved?
Jenn: Yes! I love teaching. I’ve always enjoyed teaching and mentoring. I actually took a gap in my data-focused career to teach middle school for two and a half years. After that, I had the opportunity to teach as an adjunct faculty member, and then I started making my own online courses. Generally, I just love to learn and then I love sharing what I’ve learned, so I think that’s what draws me to teaching. I also want more people to have access to data skills (including visualisation), which motivates me to teach.
Kimly: What do you love about teaching and coaching?
Jenn: I love helping people develop new skills. I also love seeing how people take the things I’ve taught them and create amazing things that are beyond what I could imagine or create. It’s so awesome to give someone a new skill and then see them apply it in interesting and unique ways.
Kimly: What have you learned about yourself through the act of coaching and mentoring others?
Jenn: I’ve definitely learned how to be a better teacher and instructor. As I work with more people, I get to improve my own skills in teaching and learn more about how to teach in different ways. I also get to learn things about R and data visualisation from the questions people ask. About myself, I think it has reaffirmed how much I enjoy coaching and mentoring and how much energy I get from teaching and working with people.
Kimly: You, yourself use a lot of R Studio in your own work – why R? What sets it apart from other data visualisation tools?
Jenn: I love using R! Partially because I really enjoy coding and also because of the flexibility possible when creating visualisations in R. I also like that all of the data processing, analysis, and visualisation can be done in a single tool with R. The requirement for coding sets it apart from other data visualisation tools – there are certainly other tools that require coding, but there are also many that do not. The flexibility of being able to completely customize the visualisation is another thing I really like about R and other code based visualisation tools – each element of the visualisation can be set programmatically. This also means that the visualisation can easily be reproduced because it’s been entirely created with code.
Kimly: What advice would you give to someone who is wanting to start out in R Studio?
Jenn: I actually have a whole blog post with some tips for learning R! But my main advice would be to find a good resource like a book, series of videos, or a class. And then practice and keep practicing, ideally on a topic of interest to you. It’s also helpful to find a community, like R Ladies or another group of people working in R.
Kimly: Did you love it right away, or was it something you learned to love over time?
Jenn: I don’t think I loved it right away when I first learned R in grad school, but then I was also learning base R without all of the packages that are available now that make R much more user friendly and able to do more complex analyses and visualisations. Once I returned to R in a later job and then again for experimenting with visualisation through #TidyTuesday, I learned to love it.
Kimly: A lot of she will viz readers are Tableau practitioners and I know you use Tableau yourself at times. For you, how does Tableau compare to R Studio?
Jenn: Tableau is a great tool, especially for building dashboards and interactive visualisations. It’s also great for visualising dynamic data. R can be used for dashboarding, interactive visualisations, and dynamic data, but I use it for static visualisations and stand-alone visualisations. Tableau definitely requires less coding than R, although some of the complex calculations can involve a lot of logic and functions.
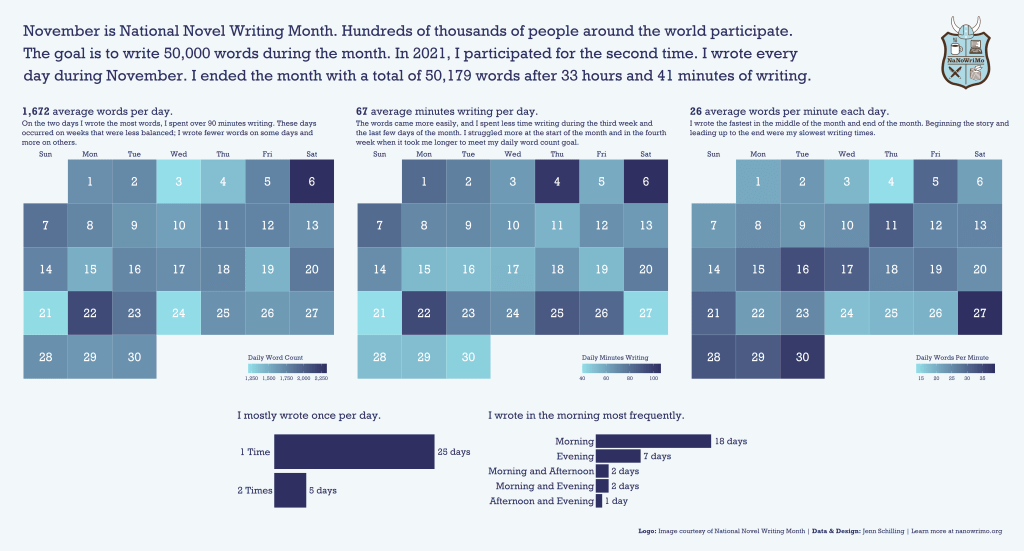
Kimly: Let’s chat about your data visualisation ‘A Year of Reading’ where you visualised the 117 books you read in 2022. That’s a lot of books! And I’m so wildly impressed that 77% of the authors you read were women. Was that intentional – to have your reading list skew towards women authors?

Jenn: I love to read! I guess it’s somewhat intentional – I tend to read and enjoy books about and by women. And I do seek out books by women, especially when I read about data, because I want to support women authors.
Kimly: I love how there is so much information packed into this visualisation. Did you track your books and the associated data with the intent to visualise your reading habits?
Jenn: I got the idea sometime during the year in 2021 to visualise my reading, so that’s when I started tracking it with that intention. Since then I’ve kept an annual Google Sheet to track the books I read during the year.
Kimly: Did you have a chart type or design in mind when you started the visualisation or did that require some tinkering? Were there any aspects of the design that you struggled with?
Jenn: I was inspired by the book visualisations in Dear Data by Giorgia Lupi and Stefanie Posavec as well as a bookmark I received with a book subscription box, so I had the stacked bar graph visualisation in mind, but I definitely experimented some as I went. I wrote a LinkedIn Article with more information about creating the initial visualisation for 2021. I think the hardest part was getting the R code to create everything as I had it in my mind, but otherwise this one came together pretty much how I envisioned it.
Kimly: We’re halfway through 2023, what does your reading list look like so far this year? Are you looking to beat 117 books?!
Jenn: As of the start of June, I’ve read 38 books so far this year. I’m not sure if I’ll beat 117 books, but for me the tracking is more about reflecting a little on what I read, keeping track of my favorites, and looking for trends rather than a specific goal of a number of books in a year.
Kimly: You have a connection to the women in the data viz community through initiatives such as Women in Dataviz, RLadies, Women who Code – why do you feel that it’s important to be part of communities like this?
Jenn: It’s important to be part of communities like this because when we’re in a community with people who have similar identities, we can support one another, grow together, and have a safe space to talk out issues and challenges. I’ve experienced some of the challenges of being female in STEM, so it’s important to me to not only have those spaces for myself but also to mentor and support others so we can improve the work and education environments for everyone and also encourage more people from different backgrounds in the field.
Kimly: How does being part of communities like this benefit you and how can it benefit others?
Jenn: It’s benefited me by having a space to share and engage with people of similar identities. Many of these organizations also offer training and mentoring, which I’ve benefited from and think anyone can benefit from. These communities can also be a place to find collaborators for a project and even make friends with people who are working in similar fields.
Kimly: And lastly, who are some women in data viz who inspire you?
Jenn: There are so many!
Here are some: Giorgia Lupi, Stefanie Posavec, Shirley Wu, Stephanie Evergreen, Cole Nussbaumer Knaflic, Nadieh Bremer, Jen Christiansen, Edit Gyenge, Nicole Mark, Or Misgav, Nicole Lachenmeier, Christina Gorga, Mandy Spaltman, Jessica Moon, Martina Zunica, Irene Alisjahbana, Hana Khan, Mico Yuk.
***
Thank you so much Jenn for sharing your experiences. I really admire Jenn’s passion for teaching, and generally wanting to help others become better at data visualisation. You can follow Jenn on Twitter, and do check out of all Jenn’s awesome resources on her website.
Kimly
